 |
|
 |
| Mission | Search | Acknowledgements | Discussion Group | Contact Us | Links | ||
| ||||||
|
Maine DEP Monthly
Maine and WEF's
Penobscot Watershed and Development of a TMDL
Maine Rural Water
Maine
Wastewater Control Association |
AERATED
LAGOON TECHNOLOGY by
Technical Note Number 6 NITRIFICATION
IN AERATED LAGOONS
|
|
|
This reaction results in the decrease in bicarbonate alkalinity as well as an increase in the carbon dioxide concentration, both occurrences of which lowers the pH. If the wastewater has a relatively low alkalinity, the change in pH can be dramatic. In turn, the low pH can significantly reduce the rate of nitrification. Below a pH of 7.2, the rate falls precipitously, approaching zero at a pH of 6. Based on Eqs. 1 and 3, approximately 7.2 mg of bicarbonate alkalinity (as CaCO3) are required to neutralize the hydrogen ions produced by the oxidation of 1 mg of ammonium nitrogen to nitrite. Thus, wastewaters with low alkalinity require the addition of alkalinity to support uninhibited nitrification. In addition to pH, nitrification is very sensitive to temperature, the dissolved oxygen concentration, and toxic materials. The literature on nitrification is extensive. Papers by Sharma and Ahlert (1977) and Barns and Bliss (1983) offer excellent reviews of factors influencing nitrification.
NITRIFICATION IN AERATED LAGOONS
During warm weather months, some nitrification generally occurs in most
aerated lagoons treating domestic wastewaters. However, such nitrification is
usually unpredictable and cannot be depended upon to meet effluent limits. The
reason is that the organisms responsible for nitrification are slow growers and
more sensitive to environmental factors than are those that remove BOD5. Figure
1 illustrates the impact that temperature has on nitrification. The curves,
which was prepared by using the kinetics used by Downing et al. (1964), Downing
and Knowles (1966), and Parker (1975), predicts the hydraulic retention time (HTR)
required in an aerated lagoon to achieve an effluent ammonia nitrogen
concentration of 2 mg/L if all the biomass is maintained in suspension, if
sufficient alkalinity is present to meet the requirement for nitrification, if
the dissolve oxygen is maintained at 2 mg/L, if there are no toxic materials
present, and if the influent conditions do not vary. Obviously, these
limitations are not met on a consistent basis in the real world; hence even
longer retention times would typically be required. Since cold weather
temperatures in lagoons in the Southeast may drop to as low as 8 to 10°C, an HRT
of at least 6 to 7 days would be required for year-round nitrification.
Considering the fact that the completely-suspended biomass conditions require
aeration power of about 6 W/m3 of basin volume (30 hp/106 gal), such retention
times are excessive from the stand point of power usage. Power for solids
suspension would be about three times that required to meet the oxygen demand.
Therefore, for aerated lagoons to be considered as viable processes for
nitrification, the lagoon process must be modified so that the solids age can be
uncoupled from the HRT. This can be accomplished either through sedimentation in
clarifiers with solids recycle or through the retention of solids by use of
sequencing batch reactor (SBR) technology. An example of the latter will be
discussed in a later technical note. However, there are available add-on
processes that can be used to nitrify effluents of aerated lagoons. These
include the intermittent sand filter, a process for which long term performance
records are available that demonstrate its success as a nitrifier and polisher
with respect to TSS and CBOD5.
|
|
Figure 1.
Influence of temperature on
hydraulic retention time required to achieve nitrification in
a completely-suspended aerated lagoon under optimum conditions.
NITRIFICATION WITH INTERMITTENT SAND FILTERS
The design of intermittent sand filters can be found be found elsewhere (USEPA
1983, Rich 1999). Intermittent sand filters have been used to polish effluents
of both facultative and aerated lagoon systems. Their use with the dual-power,
multicellular aerated lagoon discussed in Technical Note 5 has been particularly
successful. These systems produce effluents low in TSS, a factor that not only
reduces the frequency at which the filters have to be cleaned, but also makes
possible higher loading rates and smaller filters.
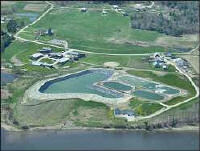
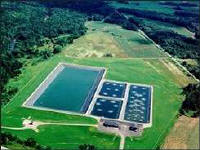
Table 1 lists the effluent characteristics of three DPMC lagoon –
intermittent sand filter systems in South Carolina. The Ocean Drive and Crescent
Beach plants have been in operation for about for about 13 years; the Loris
plant for about 8 years. The table tabulates the mean and 90 percentile values
of the TSS, BOD5, and the ammonia nitrogen in the effluents of the plant. From a
regulatory standpoint, 90 percentile compliance with effluent limitations is
adequate (Rott 1996). All three systems require alkalinity addition for
nitrification. In the operation of the Ocean Drive and Crescent Beach plants, it
has been found that if the pH of the lagoon effluent is maintained between 7.5
and 8.0, the ammonia nitrogen of filter effluent will generally be less than 0.5
mg/L. However, since the two plants are meeting their ammonia nitrogen limits of
2 and 4 mg/L, March through October, there is no incentive to achieve the lowest
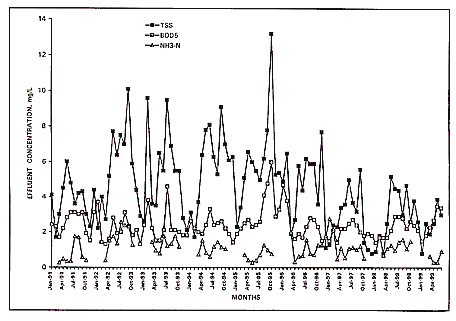
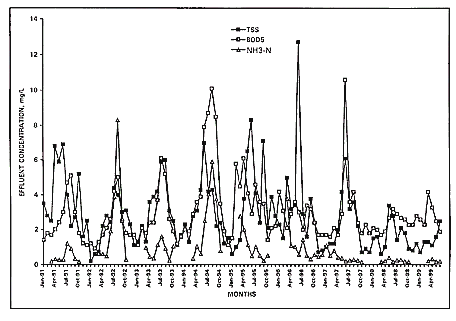
concentrations possible. Figures 1 and 2 illustrate 8.5 years of the monthly
records at these two plants. Table 1 in Technical Note 5 shows the effluent
ammonia nitrogen found in the intensive three day study of the Ocean Drive plant
by EPA described in that technical note.
| OCEAN DRIVE |
CRESCENT BEACH |
LORIS | |
| Size, mgd | 3.4 |
2.1 |
0.7 |
| Length of record, yr | 8.5 |
8.5 |
4.6 |
| TSS, mg/L | |||
| 50 percentile | 4.5 |
2.8 |
3.1 |
| 90 percentile | 7.5 |
5.4 |
5.2 |
| BOD5, mg/L | |||
| 50 percentile | 2.4 |
3.0 |
1.8 |
| 90 percentile | 3.4 |
5.3 |
3.0 |
| NH3-N, mg/L | |||
| 50 percentile | 1.1 |
1.0 |
1.3 |
| 90 percentile | 1.8 |
2.8 |
3.0 |
Figures 2 and 3 illustrate the monthly effluent records of the Ocean Drive and
Crescent Beach over the 8.5 year period. Such stability combined with the
minimal skills and attention required to operate the systems, makes the systems
viable alternatives to the activated sludge process, especially in those areas
where land costs are not excessive and cheap sand is available. A copy of a
paper entitled A Cost Comparison of a Low-Tech Alternative to Activated Sludge
by Mike Bowden and Bruce Henry is available upon request at bowden.mike@epamail.epa.gov
or henry.bruce@epamail.epa.gov.

Figure 2.
Monthly average effluent TSS, BOD5, and
NH3-N
at Ocean Drive plant, North Myrtle Beach, SC.

Figure 3.
Monthly average effluent TSS, BOD5, and
NH3-N at Crescent Beach plant, North Myrtle Beach, SC.
REFERENCES
Barnes, D. and Bliss, P. J. (1983). Biological Control of Nitrogen in Wastewater
Treatment. E. and F. N. Spon, New York, NY.
Downing, A. L. et al. (1964). “Nitrification in the activated sludge process.”
Journal, Institute of Sewage Purification.
Downing, A. L. and Knowles, G. (1966). “Population dynamics in biological treatment plants.” 3rd International Conference On Water Pollution Control, Munich, Germany.
Parker, D. S. (1975). Process Design Manual for Nitrogen Control. Technology Transfer Manual, U. S. Environmental Protection Agency, Washington, DC.
Rich, L. G. (1999). High Performance Aerated Lagoon Systems. American Academy of Environmental Engineers, Annapolis, MD.
Rott, G. G. (1996). “Alternative to CBOD5-based load allocations studies on low-dilution ratio streams.” J. Envir. Engrg. Div., ASCE, 77, 669-671.
Sharma, B. and Ahlert, R. C. (1977). “Nitrification and nitrogen removal.” Water Res., 11(10), 897-925.
USEPA (1983) Design Manual: Municipal Wastewater Stabilization Ponds. EPA-625/1-83-015, U. S. Environmental Protection Agency, Washington, DC.
|
|
Effluent BOD5 - A Misleading Parameter For the Performance of Aerated Lagoons Treating Municipal Waste |
|
|
Aerated Lagoon Effluents |
|
|
Control of Algae |
|
|
Nitrites and Their Impact on Effluent Chlorination |
|
|
Aerated Lagoons for Secondary Effluent |
|
|
Nitrification in Aerated Lagoons With Intermittent Sand Filters |
|
|
Mixed Liquor Recycle (MLR) Lagoon Nitrification System |
|
|
Facultative Lagoons - A Different Technology |
|
|
Sludge Accumulation in High Performance Aerated Lagoon Systems |
|
|
Ammonia Feed Back in the Sludge of a CFID Nitirification System |
|