|


2003
Maine Wastewater Salary Survey as conducted by the Maine Wastewater Control
Association
2003 Maine
Wastewater Rate Survey conducted by the Maine Rural
Water Association

Maine DEP Monthly
O & M Newsletter
Maine and WEF's
Operation Forum
Penobscot Watershed and Development of a TMDL
EPA Binational Toxics
Strategy
Maine Rural Water
Association
Maine Wastewater
Operator Certification
Guide
Maine Is Technology
Newsletter
Maine
Wastewater Control Association

Maine
Wastewater Engineering
Firms
| |
AERATED
LAGOON TECHNOLOGY

by
Linvil G. Rich
Alumni Professor Emeritus
Department of Environmental
Engineering and Science
Clemson University -
Clemson, SC 29634-0919 USA
Email: lrich@clemson.edu;
Tel. (864) 656-5575; Fax (864) 656-0672
Technical Note Number 5
AERATED
LAGOONS FOR SECONDARY TREATMENT
Historically, effluent data for aerated lagoons
treating municipal wastewaters have been expressed in terms of BOD5 and TSS.
This is unfortunate. As was discussed in Technical Note 1, the BOD5 parameter is
faulty because of its inflation by nitrification taking place in the BOD5 test.
Arguing that secondary BOD5 limits were initially established on the basis of
values flawed by nitrification, the U.S. EPA has suggested that the CBOD5 limit
for secondary treatment be 25 mg/L rather than the 30 mg/L allowed when the
limit is stated in terms of BOD5. For this reason, secondary treatment will be
defined here as treatment that will consistently meet effluent limits of 25 mg/L
for CBOD5 and 30 mg/L for TSS.
Typically, the general configuration of aerated lagoon systems used in the
past to treat domestic wastewaters takes the form of an aerated basin followed
by an unaerated polishing pond. Effluent from this type of system rarely meets,
on a consistent basis, the secondary limits stated above. Figure 1 illustrates
the effluent performance of such a system in Georgia. As was discussed in
Technical Note 2, practically all of the effluent TSS and CBOD5 is caused by
algae that grows in the lagoon. This being the case, why not design the lagoon
system in such a way that algal growth is minimized?
Figure 1.
Effluent characteristics of an aerated lagoon
system in Georgia treating a domestic wastewater. (Courtesy of Bruce Henry)
Figure 2 illustrates in a conceptual way how
algal growth can be minimized through control of the hydraulic retention time (HTR).
There is a minimum HTR (point a) required to reduce the influent CBOD5 to an
acceptable level. There is also an HRT (point b) beyond which algae become
established and grow. The key to the design of a system that will produce an
effluent with minimal algae is to design a system where the effective HRT falls
between points a and b, preferably close to point b considering the sludge
storage function of the system. Also, it must be kept in mind that the effective
HRT should be based on a consideration of the initial flow rate as well as the
design rate. It is just as important for the system to perform well the day that
it goes into operation as it is at the end of its design life. One such system
is found in Figure 3.
Figure 2.
Conceptual sketch of influence of
hydraulic retention time (HRT) on lagoon effluent CBOD5
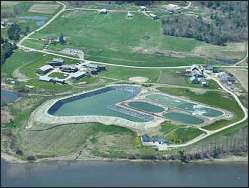
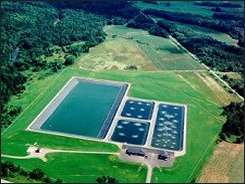
Figure 3.
Photograph of a DPMC aerated lagoon
system
DPMC AERATED LAGOON SYSTEMS
Figure 3 is a photograph of a
dual-power, multicellular (DPMC) aerated lagoon system. The DPMC systems were
considered innovative as recent as a decade ago. Now, however, many such systems
are operating successfully in the southeastern United States and elsewhere.
Design details are found elsewhere (Rich 1999). Essentially, the system consists
of four cells in series. For municipal wastewater treatment in the southeastern
United States, the system will have, at design flow, a total HRT of 4.5 to 5
days, and a depth of at least 3 m. The first cell (HRT = 1.5 - 2 d) is aerated
at 6 W/m3 of volume (30 hp/mgal), a level that will 1) maintain all solids in
suspension, and 2) provide oxygen sufficient for the conversion of the influent
CBOD to carbon dioxide and biomass. The following three cells, each with a HRT
of approximately 1 d, serve the functions of sedimentation, solids
stabilization, and sludge storage. Each cell is aerated at 1 W/m3 of volume (5
hp/mgal), a level that permits the settleable solids to settle, but, is
sufficient to maintain a thin aerobic layer at the top of the solids deposit.
The aerobic layer reduces feed-back of nitrogen and CBOD to the water column,
and maintains a stable deposit. Aeration also reduces the dead-space volume of
the cells.
Since the control of algal growth is crucial in the reduction of effluent
suspended solids, careful attention is paid to factors influencing such growth.
The turbidity created in the first cell by maintaining all settable solids in
suspension reduces light in the water column to the extent that very little
algal growth occurs in that cell. The focus of concern, therefore, centers on
factors in the remaining three cells. Those factors include HRT, multicellular
configuration, surface area, and mixing.
Solids stabilization rates are another
consideration in the design of DPMC systems. Benthal stabilization occurs as the
result of a combination of aerobic and anaerobic mechanisms. The bottom surface
area of the cells must be large enough that the solids loading will not exceed
that which will result in all biodegradable solids being stabilized over the
annual temperature cycle. The frequency at which the sludge must be removed from
the system is also a consideration. One DPMC system treating a domestic
wastewater for over twelve years at 40 percent of the design hydraulic load has
not required sludge removal.
Control of the HRT in DPMC systems is critical to
good performance. Where initial flow rates are significantly lower than design
flow rates, three options are available to the designer. One option is to divide
the system into parallel trains, additional trains to be brought into operation
as the wastewater flows increase. The second is to design the system to operate
at multiple depths. Thanks to the shallow slopes of typical lagoon basins, a
volume increase of almost 50 percent can be attained by increasing the operating
depth from 3 m to 4 m. The third option is to install effluent weirs in all
three settling cells, and discharge from the cell giving the best effluent.
PERFORMANCE
Since the DPMC system is in the public domain and no warranties apply to
ensure proper design, many engineers inject their own biases and irrational
reasoning when they design these systems. One of the biggest mistakes is to add
additional HRT as a safety factor. Another is to omit aeration in the last
settling cell. Furthermore, even if all settling cells are provided with
aeration, operators, to save on power costs, will often operate the aerators
intermittently. Of course these mistakes result in more algae, and hence, higher
effluent TSS and CBOD5 values. For these reasons, the performance data presented
here are for systems in which the author is confident that they have been
designed and operated correctly.
Figure 4 illustrates the performance record of a DPMC system located in
Berkeley Co., SC. The record was taken from the monthly discharge monitoring
reports submitted to the state regulatory agency. Typically, BOD5 was determined
rather than CBOD5. In the 9.5 year record presented in the figure, the TSS and
BOD5 values never reached 30 mg/L. Keeping in mind that the CBOD5 in the
effluent would be less than the corresponding value of the TSS, one can see that
the system can clearly meet the 25/30 limits on a consistent basis. The average
of the parameter values, both BOD5 and TSS, measured during this period of time
was about 12 mg/L.
Figure 4.
Effluent TSS and BOD5 of a DPMC
aerated lagoon system in Berkeley Co., SC
Figure 5 illustrates the performance of a DPMC lagoon (2 mgal/d) located at
Hampton, SC. The lagoon is followed by an intermittent sand filter for
nitrification. Consequently, effluent data is normally collected for the entire
system, rather than just for the lagoon. However, a short study was conducted to
evaluate the performance of just the lagoon. The first point to be made about
Fig. 5 is that the lagoon effluent TSS values were amazingly low, this in spite
of the fact that the system was operating at a flow rate of 25 percent of the
design rate. The second point is that the BOD5 values are all grossly inflated
by nitrification occurring in the BOD5 test. The corresponding CBOD5 values, had
they been determined, would have been less than the TSS values.
Figure 5.
Effluent TSS and BOD5 of a DPMC
aerated lagoon system at Hampton, SC
Figure 6 is a sketch of another DPMC
lagoon - intermittent sand filter system. This system, with a design capacity of
3.4 mgal/d, is located at North Myrtle Beach, SC, a resort community where the
flows during the summer months are about 3 to 4 times the flow in the winter
months. For this reason, the system was designed with two DPMC lagoons in
parallel, both discharging to one of nine intermittent sand filters. The system
has been in operation for about 12 years, and, for this period of time, only the
effluent from the entire system has routinely been evaluated. However, in
October 1997, the U. S. EPA, Region 4, Enforcement and Investigations Branch
conducted an intensive three day, on-site study of the plant followed by a
six-month post evaluation to confirm its performance and to study its costs.
Table 1 tabulates the results in terms of the means of two, 24 hour composite
samples. The sampling points are indicated in Fig. 6. Flow through the plant
during the studies was approximately 50 percent of the design flow.
Table 1.
Effluent characteristics of the DPMC
aerated
lagoons at North Myrtle Beach, SC
|
|
INF |
A1 |
B1 |
A4 |
B4 |
EFF |
|
BOD5a |
160 |
21 |
23 |
10 |
12 |
2 |
|
CBOD5b |
165 |
16 |
20 |
8 |
6 |
1 |
|
SCBOD5c |
62 |
5 |
5 |
4 |
4 |
1 |
|
TSSd |
185 |
79 |
77 |
8 |
4 |
4 |
|
ALK.e |
195 |
190 |
190 |
210 |
220 |
17 |
|
NH3-Nf |
25 |
25 |
28 |
31 |
30 |
1 |
|
NO3-Ng |
0.07 |
0.05 |
0.05 |
0.09 |
0.44 |
32 |
|
TKNh |
37 |
35 |
40 |
34 |
33 |
2 |
|
TPi |
5.9 |
2.8 |
3.3 |
0.6 |
1.2 |
0.8 |
|
CHLOR Aj |
- |
- |
- |
0.056 |
0.043 |
- |
a Standard 5-day, 20°C biochemical oxygen demand
b Carbonaceous BOD5
c Soluble carbonaceous BOD5
d Total suspended solids
e Alkalinity as CaCO3
f Ammonia nitrogen
g Nitrate + nitrite nitrogen
h Total Kjeldahl nitrogen
i Total phosphorus
j Chlorophyll a
REFERENCE
Rich, L. G. (1999). High Performance Aerated Lagoon Systems. American Academy of
Environmental Engineers, Annapolis, MD

|