|
Lagoons and ponds refer broadly to basins constructed
in, or on the ground surface, using earthen dikes to retain the
wastewater within which natural stabilization processes occur
with the necessary oxygen coming from atmospheric diffusion,
photosynthetic and/or mechanical sources. More specifically, there
are facultative stabilization ponds, complete mix aerated
ponds, partial mix aerated lagoons, anaerobic lagoons and various
hybrids. In Maine most of the lagoons and ponds are partial mix
aerated lagoons and facultative stabilization ponds. This manual
addresses the design, operation, and regulatory control of
municipally operated partial mix aerated lagoons and stabilization
ponds and is intended to be a tool for operators, engineers and
regulators.
For more than thirty-two years lagoons and ponds have been used in
Maine to treat municipal and industrial wastewater. During that
time, some of these facilities have experienced problems meeting
biochemical oxygen demand (BOD5) and total suspended solids (TSS)
permit requirements. More recently, it has been recognized that
nitrification occurs in lagoons and that nitrification may interfere
with the interpretation of BOD5 test results.
In 1994, an internal Department of Environmental Protection (DEP)
staff committee was formed to evaluate the performance of lagoons
and ponds. The DEP staff presented its findings and recommendations
at a public workshop on October 24, 1995. During that workshop,
several issues were identified and workshop participants agreed that
a task force should be established to resolve the issues. A task
force made up of DEP staff, consulting engineers and treatment plant
operators held its first meeting on December 13, 1995. The task
force identified that there were problems with some of the lagoons
and ponds meeting BOD, TSS and pH permit limits and agreed that it
would work to produce written, experience based guidelines,
recommendations and collaborative procedures for the licensing,
design, and operation of aerobic facultative lagoons. The task force
further agreed that the guidelines, recommendations and procedures
would promote cost-effective, environmentally sound and flexible
industry practices which recognize the interrelationship of user
needs. The purpose of this manual is to describe the findings and
outline the recommendations of the Lagoon Task Force. The manual
contains six major sections that provide background information,
data-analysis, design considerations, operation considerations,
regulatory considerations, and a summary of conclusions and
recommendations. The appendices contain a discussion of biological
treatment concepts and nitrification in lagoons and ponds, a
glossary of terms, inventory of facilities in Maine, facility
operating data, references, resources, and a subject index.
The task force believes that most lagoons and ponds in Maine can
meet appropriate permit limits for the technology defined by the
U.S. Environmental Protection Agency as secondary treatment or in
some cases as "equivalent of secondary treatment". Variations in
treatment performance are due largely to varying climatic and
seasonal conditions. The task force believes that implementation of
the recommendations outlined in this manual will reduce the number
of violations from lagoons and ponds and improve the performance of
these systems in general. This approach will require that DEP and
EPA demonstrate flexibility in permitting lagoons and ponds,
consulting engineers must recognize that these systems have unique
design needs, and that the wastewater treatment plant operators must
work to understand the changing system dynamics and optimize the
performance potential given climatic and seasonal constraints.

BACKGROUND

The lagoon task force consisted of three volunteer members from each
of three different sectors: the DEP, engineering consultants and
treatment plant operators. The task force used a process action team
approach and process facilitator to provide a framework for
conducting its meeting and working together. A process action team
approach is a systematic way for teams to learn about a process
where decisions are based on data rather than hunches, root causes
of problems are identified rather than reaction to superficial
symptoms, and permanent solutions are developed rather than quick
fixes. The process facilitator is a person who is responsible for
keeping meetings focused and moving. Derek Davidson from the DEP
Bureau of Remediation and Waste Management served as the
facilitator. The members of the task force (in alphabetical order)
were as follows:
|
 Donald
J. Albert, P.E. Donald
J. Albert, P.E. |
DEP |
|
Gary R. Brooks |
Veazie Sewer
District |
|
David Dodge |
DEP |
|
John H. Fancy |
John Fancy,
Inc. |
|
James H. Fitch, Jr., P.E. |
Woodard &
Curran, Inc |
|
Dennis Merrill |
DEP |
|
Stephen D. Murray, P.E. |
James W. Sewall
Co. |
|
Edward E. Petrilak |
Norway Pollution
Control |
|
David W. Stiles, P.E. |
Wright-Pierce
Engineers |
|
Steven
C. Hallowell |
Wright-Pierce
Engineers |
The lagoon task force met twenty times
over an eighteen month period to develop its findings and
recommendations. During the first meeting the group established
ground rules and adopted a decision-making process. Next the group
identified the needs of its users, what the "end product" should be
and a process for meeting its objectives. The task force identified
the end product that it will produce as: "written experience based
guidelines, recommendations and collaborative procedures for the
licensing, design and operation of aerobic facultative lagoons".
These guidelines, recommendations and procedures will promote
cost-effective, environmentally sound and flexible industry
practices which recognize the interrelationship of user needs. The
group identified the primary users as lagoon designers, operators
and regulators.
During the fourth meeting the task force
defined lagoon systems, developed a written statement of the problem,
and reviewed existing information. The definitions used by the task
force during its discussions were established as follows:
Stabilization Ponds are systems
which do not have mechanical aeration. Partial Mix Aerated Lagoons are
systems which have mechanical aeration but also may employ some
facultative processes. Partial mix aerated systems are a transition
group between stabilization ponds and complete mix lagoons with
significantly different operating characteristics as you move from one
end of the scale to the other. Complete Mix Aerated systems have
significantly higher mixing energy and are closer to activated sludge
reactors. They are mixed to the extent where there are no clearly
delineated zones of stratification. Because these systems are more
like activated sludge plants than lagoons and have different
compliance problems, they were not included in the task force review.
There are no municipal treatment facilities in Maine using this type
of system.
The problems were identified as
non-compliance with effluent standards for BOD, TSS and pH from
aerated facultative lagoons.
Next, the group brainstormed and
categorized potential cause(s) of the problems (see the appendix). The
potential causes of the compliance problems were categorized into four
groups: 1) environmental factors, 2) design (flexibility), 2) mixing
and aeration, and 4) operation.
Following this, the task force worked on
gathering data and information. The task force met with Paul Mitnik,
P.E., a water quality expert with the DEP, and Dr. Michael Richard, an
operational consultant, to discuss water quality and plant operation
issues. The group reviewed existing permit compliance data and
facility operation data. Using teams of two, the task force visited
twenty-two lagoons and ponds in Maine. A survey questionnaire was used
to provide consistency from one visit to another.
After gathering data, the task force
worked to identify the most probable causes of permit compliance
problems. The causes of the problem were grouped into four categories:
design, operation, regulatory and miscellaneous issues. The task force
divided itself into three working sub-groups to develop design and
operation recommendation and to evaluate the historic operating data
to identify trends that may indicate opportunities. The task force
decided that the regulatory issues should be worked on together as an
entire group. The design sub-group consisted of Steve Hallowell, John
Fancy and Ed Petrilak. The operation sub-group consisted of Jim Fitch,
David Dodge and Gary Brooks. The data analysis sub-group consisted of
Steve Murray, Don Albert and Dennis Merrill.
Finally, the sub-groups worked to
prepared drafts of their findings and recommendations. These were
reviewed by the entire group and incorporated into this final manual.
DISCUSSION OF DATA
3.1 Introduction
As part of the facility review, the task
force examined the past effluent performance trends for most lagoon
and pond facilities. This was done in two parts. The first was a
statistical evaluation employing methods similar to those used by EPA
in establishing technology-based effluent standards. This effort is
described in the Regulatory section of this manual. The second was a
review of individual facility performance in an effort to identify
possible trends, both for individual facilities and for groups of
facilities. In addition to effluent data, some consideration was given
to evaluation and comparison of operating data and design criteria.
While these factors entered into the task force's general discussions,
they were not developed as a detailed data analysis. A cursory review
of design criteria, operating conditions and effluent quality did not
suggest any strong correlation between these factors. Facilities
having similar design and actual loading characteristics sometimes had
considerably different effluent performance. With all data reviews,
several factors must be considered. Differences between facilities can
complicate direct comparisons, and even for the same facility,
seasonal changes from year-to-year can be significant. Revisions to
operating strategies, equipment, influent loading, or abnormal events
can all influence the performance of a facility, either on a one-time
basis or as long-term trends.
3.2 Methods
To provide the maximum consistency in
comparison of data, only effluent concentrations for BOD and TSS were
considered; these parameters have been the subject of the most concern
in defining lagoon performance standards. Where available, monthly
average effluent concentrations from 1989 through 1996 were
considered. In some cases, shorter records were used where facility
had not been in operation for the entire period or if major changes
had been implemented rendering previous data not representative of
current conditions. Facilities operating in a hold and release mode
were considered separately for some purposes, such as determining
seasonal trends and in evaluating compliance with effluent limits.
The monthly average effluent
concentrations were obtained from monthly discharge monitoring reports
submitted by the facilities. That information was downloaded from
EPA's Permit Compliance System where it is normally entered and
stored, and was then organized and edited on personal computers. Two
presentations of the monthly average concentrations were made, and are
presented in appendix D. The first presentation is line graphs showing
monthly average BOD and TSS concentrations for the entire period
evaluated at each facility evaluated. The monthly average flows are
also included with these data. The plots are useful in determining
long-term trends in performance. In some cases, high concentrations in
certain years can easily be identified, suggesting unusual
performance.
The other data presentation is a
composite of monthly averages by month for each facility. These were
compiled by averaging all of the available monthly averages for each
month of the year. The resulting bar graphs in appendix D are useful
in evaluating seasonal trends in BOD and TSS concentrations for each
facility and for comparing these trends with other facilities. In some
cases, peaks in one or two specific years tended to influence the
long-term monthly averages for certain months. By comparing the line
graphs showing several years of performance with the bar graphs the
significance of high months could be better understood. If there is a
single high peak in one year, less importance should be placed on the
increased composite monthly average than one representing fairly
consistent performance over several years.
3.3 Discussion
The bar graphs of monthly averages were
compared to one another to determine what common trends might exist.
Comparisons were made for all BOD concentrations as a group, all TSS
concentrations as a group, and BOD and TSS concentrations for the
individual facilities. As might be expected given the variables
involved, no strong or universal correlations or "profiles" were
identified. However, some trends and groups could be found. Because
discharges do not occur year-round for hold and release facilities,
this group of five facilities was not included with the other
facilities. The profiles for these facilities were quite similar,
showing higher effluent concentrations during the discharges in the
winter into spring. Discharges in the fall generally had lower
effluent concentrations. For the other facilities which discharge more
or less all year, the profiles fell into several broad groups.
When considering the profiles for BOD
concentrations, they can be broken down into four broad groups. Four
facilities tended to have higher BOD concentrations in the summer into
fall months. At least two of these facilities experience significant
nitrification, so higher total BOD concentrations during the warmer
months are not surprising. In this group, the effluent concentrations
are generally higher than those seen in other groups. Five facilities
had higher BOD concentrations during the winter and spring months.
Overall, these facilities had the lowest BOD concentrations. Four more
facilities also presented a trend of higher spring time BOD's,
although not as strong or well defined. The profiles for a final two
facilities had no particular trends.
The profiles for TSS concentrations were
somewhat less well defined than those for BOD. At five facilities, the
TSS concentrations were highest during the middle part of the year,
roughly from May through September. This group had the highest
effluent concentrations. Since the warm conditions and ample sun light
during these months are favorable conditions for algae growth, the
higher concentrations are not unexpected. However, a second group of
five facilities had peak TSS concentrations earlier in the year,
spring into early summer. This group generally had lower TSS
concentrations, and July through September sometimes had the lowest
values of all months. The profiles for another three facilities showed
TSS concentrations increasing from the summer into the fall. The two
remaining facilities demonstrated no defined profile. In many
facilities, April and especially May proved to be the worst time of
the year for TSS discharges. This coincides with observations during
the Teams site visits that spring time algae blooms and turnover were
reported to be common and sometimes severe. Conversely, August TSS
concentrations were often low, perhaps reflecting algae die-off due to
the longer detention times resulting from lower flows and evaporation
during the summer.
DESIGN
CONSIDERATIONS
4.1 General
This Section deals with design
considerations for all new and future upgrades of existing aerated
lagoon wastewater treatment facilities. The following design issues
are to be considered in addition to those standards presently
established in TR- 16, Ten State Standards or any other published
literature accepted by the DEP or EPA. These design considerations
were established by the DEP Lagoon Task Force and based on the site
visits of the task force members to each of the existing treatment
facilities.
4.2
Facility Planning
The DEP and EPA should be contacted
early in the process to determine treatment objectives and permit
limits.
The raw wastewater characteristics
(BOD5, TSS, TKN, ammonia and alkalinity) and flows should be
accurately defined.
Infiltration / inflow allowances should
be made for all new systems and upgrades.
Industrial users and large commercial
users must be evaluated for their impact on the system. Reaction rates
can change significantly with substantial industrial or commercial
wastes. Sludge may accumulate at a faster rate with certain industrial
wastes.
4.3 Lagoon
Facilities
The heart and soul of any lagoon
facility are the total treatment volume and the flexibility to
increase or decrease the total detention time by varying the liquid
level of each lagoon at any time of the year. (One of the few
operational controls is detention time.)
-
Sizing of the treatment lagoons must
be directly related to the climatic conditions and not dictated by a
set detention time. Develop a site specific KI reaction rate
coefficient by reviewing data from nearby lagoon facilities with
similar climatic conditions, primarily in the winter months. The
three critical points are: 1) winter when temperatures and reaction
rates are low, 2) spring turnover when benthic demand from sludge
settled all winter is high, and 3) summer when temperatures and
reaction rates are high. Consideration should be given to
nitrification. The winter conditions normally control the lagoon
volume and the second or third critical points will control aeration
capacity. Volume for ice cover and sludge accumulation should be
provided in the design. Avoid small trapezoidal configurations with
small bottom areas which leads to unfavorable aeration and nixing
zones.
The number of cells may
have a significant effect on overall sizing. Normally three or four
cells should be provided. At a minimum each cell must be removable
from service while maintaining treatment.* Additional recommendations:
-
Minimum of 10 foot depth for partial
mix aerated lagoons; Multiple inlets and outlets (this minimizes
short-circuiting of the wastewater and allows the wastewater to be
evenly spread out across each lagoon); Provide bypass capabilities
for each lagoon (this allows each lagoon to be taken out of service
for periodic maintenance, process control, and discharge
flexibility); Consider providing step feed in the first lagoon cell;
Provide means to vary the water level in each lagoon (this may
consist of a flow structure with an adjustable weir gate). This
allows the detention time of each cell to be increased or decreased
independently. Valves must function in any season and may require
frost protection. Provide means to measure the water level in each
lagoon (this allows the operator to accurately measure the water
level in each lagoon and assists in the operation of the facility
throughout the year). Consider multiple draw off levels for all
cells and especially for the final lagoon cell (this allows for best
type of effluent to be discharged to the receiving water). Consider
lagoon baffles to reduce short circuiting.
-
Aeration equipment shall be capable of
maintaining a minimum dissolved oxygen of 2 mg/L at all times. The
sizing of aeration equipment should consider future growth, benthal
release, nitrification, standby equipment, and potential peak loads
from domestic, commercial and industrial wastes users. (Published
literature typically recommends providing 2-5 lbs. of oxygen per lb.
of BOD loading.)
-
To improve operator control, provide
timers, variable frequency drives and/or D.0, monitoring to control
output of aeration equipment.
-
Dedicate space for future plant
expansion. This may consist of additional treatment lagoon cells,
garages, sludge or spray/snow disposal areas, or other types of
treatment facilities.
4.4 Pretreatment Facilities
4.5 Buildings
-
Provide adequate space for the storage
of equipment, such as, safety, spare parts, laboratory, office
furniture and supplies, plans, records and files.
-
Provide adequate garage space for the
storage of equipment, such as trucks, portable trash pumps,
emergency generators, tractors or other utility vehicles.
4.6 Seasonal Discharge/Stream Sensitive
Discharge Facilities
-
Provide additional treatment
facilities such as polishing ponds, filters, sand filter beds or
artificial wetlands to help achieve low effluent BOD, TSS, algae,
ammonia and phosphorus levels when required by the discharge license
limits.
4.7
Instrumentation
4.8 Direct Purchase of Equipment
Consider the direct purchase of
the following items:
Portable trash pump
Trailer mounted emergency standby power unit
Lagoon pontoon boat with trailer
Trailer mounted high pressure sewer flusher
Office furniture
Safety equipment
Utility truck with plow
Utility tractor with brush hog attachment
Video inspection equipment for sewers
Maintenance tools and shop area
Laboratory equipment needed to perform process control
and effluent monitoring functions.
Consider the purchase of a small portable dredge in larger facilities.
Lawn mowing and grounds maintenance equipment
Phase contrast microscope
5.0
OPERATION CONSIDERATIONS
The Lagoon Task Force has
evaluated operating systems and found that effluent violations can
occur for a number of reasons, including: BOD, TSS, pH, algae, partial
nitrification (leading to nitrification in the BOD bottle), inflow and
infiltration and other problems. It appears that causes of these
violations include partial nitrification, benthal release, algae,
winter cold, detention time, storage capacity, lack of knowledge of
the dynamics of the processes at work, and recycling of BOD.
Operator's experience with these issues indicates that the following
assessments and control strategies have improved performance in some
facilities and may limit effluent violations.
5.1 INFLOW & INFILTRATION
Introduction
I/I Problems
I/I Reduction
Handling Excess Flows within the Lagoon
5. 1. 1 Introduction
Inflow and infiltration (I/I)
is extraneous, nearly clean water that enters wastewater collection
systems directly from rainfall events, snow melt, drainage of wet land
areas and from ground water. The common modes of entry are by roof
drains, storm water drains, leaky collection system manholes,
foundation drains, sump pumps and directly from the ground via leaky
wastewater collection system piping. Although the water is relatively
clean, the excess volume it creates contributes to sewer collection
system overflows, bypasses and hydraulic related treatment problems at
the wastewater treatment facility.
The impact of I / I on lagoons
is somewhat different than the effect it can have on traditional
activated sludge plants. Because the volume and detention times are so
much greater in lagoons and because there is usually not anything
equivalent to a suspended MLSS, except for in complete mix types of
lagoons, high flows do not commonly cause washouts of treatment type
solids directly to the receiving water.
In the task force's survey of lagoon
operators, few of them identified I/I as the primary cause of effluent
violations, however some of them said it contributed to treatment
problems indirectly by affecting process control, detention times,
storage capacity and the ability to control hold and release periods.
I / I is the primary cause of flows that exceed the
hydraulic design limits of lagoons in Maine. In this relatively rural
state where population and industrial growth is slow, few communities
have actually outgrown their lagoon systems. On the other hand, it is
a region of heavy rain and snow fall, high water tables and is prone
to high seasonal runoff periods. In addition, many collection systems
are old and relatively extensive in comparison to the population
served. Few lagoons in Maine have combined sewers, so most I/I is
attributed to sewer line infiltration, manhole leaks, and roof,
foundation and cellar drains.
5.1.2 1/1 Problems
I / I can impact the following aspects of lagoon
operation:
1. Detention time.
Excess flows reduce the time
wastewater can be treated within the system. If it reduces the
detention significantly or occurs during cold weather periods when
treatment activity is low, it can especially impact BOD removal.
2. Seasonal impacts.
Often I/I is worse at certain times of the
year, especially during the spring and in late fall. At these times,
the wastewater in the lagoons is colder and biological processes are
slower. Mgh flows reduce the time for treatment just when more
treatment is needed.
Although this was not commonly
reported in our survey as a major problem, seasonal increases in
influent flow and changes in its nature may affect the established
process for awhile.
Lagoons have periodic seasonal benthic release and
pond turnover periods which usually take place in the spring and fall.
Excess flows during these periods can result in pass through of excess
wastes and nutrients to downstream units and can impact the final
discharge.
3. Short circuiting.
Although short circuiting was
not identified as a common problem by operators during our survey, it
was recognized as an important factor at a few facilities.
Obviously, if a lagoon system is prone to
short-circuiting, high flows will exacerbate this condition. Often
short circuiting is associated with temperature stratification within
the lagoons, especially in cold weather. In these circumstances, high
influent flows of a higher temperature can flow across the top layer
of the lagoon above the colder, deeper, heavier layers thus receiving
only partial treatment in the passing. At times influent waters can be
warmer than the deeper lagoon layers due to changes in the seasons,
heated sources of water from industries, homes and businesses and due
to the lagoon cooling affects of mixing and aeration during colder
ambient air conditions.
4. Stratification
disruption. Many lagoons are
designed to stratify into zones of aerobic and anaerobic treatment.
Aerobic decomposition takes place in the top layer where there is
sufficient oxygen and anaerobic decomposition takes place in the lower
water and sludge layers where oxygen is lacking. There is an
interchange between the layers through settling and benthic release.
This relationship allows extended treatment through aerobic, anaerobic
and facultative processes. Excessive flows, especially of a different
temperature, can disrupt this stratification, causing partial
treatment. Colder, more dense influent flows can disrupt the bottom
anaerobic treatment layer while warmer ones can skim across the top
inhibiting zonal treatment interchanges.
5. Storage.
Obviously, excessive flows restrict
storage options.
6. Process control.
The biggest impact of excessive flows
reported by operators in our survey was its affect on their process
control options.
Many operators actively operate their lagoon systems by
controlling detention times, lagoon levels, individual cell loadings
and through step feeding. Some operators put individual lagoon cells
on or off line, store seasonally, operate to promote Daphnia, store
during poor water quality periods, manage lagoon loading and holding
times to control algae growth and algae die off, etc. Excessive flows
can disrupt these treatment strategies by using up the extra capacity
needed to make them possible. For example, controlling detention times
and individual cell loadings can be impossible under high flow
conditions. Lagoons licensed only for seasonal discharges can run out
of storage and be forced to discharge during unlicensed periods or
when effluent quality limits are not being met.
7. As in other types of
systems, I/I can impact headwork's performance,
contribute to grit build- up within the system,
cause excessive pumping, increased wear of equipment, bypasses etc.
5.1.3 I/I Reduction
As with all treatment systems,
removal of excessive I/I in the collection system is the most
effective control method. However, certain types of I/I removal can be
very expensive. Immediate replacement of leaky sewer lines is beyond
the economic capability of many communities. A long term upgrade and
replacement program needs to be developed to meet these long term
needs. At the least, it is important to get such a program started
just to prevent the existing problem from worsening.
Some extraneous water can be eliminated more
quickly and economically. Roof drains, leaky manholes and cellar
drains and sump pumps can be removed in a short period of time through
an aggressive local removal program, by providing alternate discharge
options and by more vigorous implementation of existing local codes.
Inflow protectors can be installed under leaky manhole covers. Tight
controls on new sewer line construction and on new service connections
can prevent the addition of more I/I and eliminate it in replacement
projects.
5.1.4 Handling Excess Flows Within the Lagoon
There are only a few options in
handling excessive flows within lagoon systems:
1. Draw down during low flow periods in anticipation of seasonal high
flows. Some facilities lower levels in anticipation of the springtime
surge.
2. Determine if short-circuiting is a significant problem. This can be
done through dye studies, conducting vertical temperature profiles,
observing flow patterns, measuring sludge deposit patterns and by
reviewing the hydraulic design of the facility (length to width ratio,
depth, etc.). If short-circuiting is found to be a significant
problem, evaluate the inlet and outlet configurations of the system.
Upgrade baffling arrangements if necessary. Consider redirecting flows
with aerators and/or mixers. Remove lagoon deposits that may be
misdirecting flows. Experiment with running cells in different flow
schemes that might overcome inadequacies in design, such as, splitting
flows to individual units differently, varying lagoon feed and draw
off levels, altering individual cell operating levels, etc.
3. Increasing or decreasing mixing may have some
impact on short-circuiting.
4. The use of curtains within some lagoons has helped in handling high
flows and in reducing short-circuiting.
5. Periodic measurement and removal of bottom deposits of grit, sludge
etc. as necessary, especially near inlet structures, helps to preserve
lagoon volume and prevent short-circuiting by removing obstructions
that may shunt flows in undesirable directions and/or by recreating
proper operating depths.
6. If the system has these options, put more cells on line or split
flows differently during high flow periods.
7. Observe, track and record the hydraulic characteristics of a
specific facility so that high flow problems can be anticipated in the
future and preventative actions taken.
8. Develop a written high flow response plan and revise it as
necessary.
5.2
TOTAL SUSPENDED SOLIDS
Introduction (Causes of TSS Problems) Algae
Algae Blooms
Algae Problems
Control of Algae
Daphnia
Use and Control of Daphnia
5.2.1 Introduction
Many lagoon systems have effluent and
operational problems caused by excessive TSS within their systems.
Unlike the TSS problems that often occur at activated sludge plants,
the source of the TSS in lagoons is usually not caused by a loss of
MLSS or a direct pass through of other forms of partially treated
wastewater solids. In most cases, the TSS in lagoons is in the form of
algae or, less frequently, in the form of Daphnia. Additional TSS in
effluents can derive from rising sludge deposits, pond turnover
situations or in short-circuiting. However, these sources have rarely
been reported to be the major causes of TSS violations in Maine.
5.2.2 Algae
Although some oxygen is
obtained through the interface between air and water, most kinds of
lagoons, especially aerobic, facultative and partially mixed ones,
depend on algae to produce a portion of the oxygen used by the
bacteria and other microorganisms in breaking down (treating) the
wastewater. Even though algae is a vital component of these kinds of
lagoons and needs to be promoted within the system, in excess it can
cause significant effluent compliance problems and once in the
receiving water it can exert a D.O. demand through respiration and the
process of decay. Receiving waters are especially sensitive to this
during June through September when temperatures are high and water
levels can be low.
5.2.3 Algae Blooms
Algae proliferates in lagoons
because of the ample supply of nutrients provided by the influent
wastewater stream and the good conditions of light. Because lagoons
are relatively shallow with a large surface area and the water in them
is relatively clear, sunlight gets good penetration. Most algae get
their energy for growth from sunlight through the action of the
chlorophyll that exists within its cells. Chlorophyll is green. This
is why the intensity of the green color that occurs in lagoons (as
well as in lakes) is usually a good indicator of the amount of algae
that exists within these system. Large populations of algae, often
accompanied by an intense green color are called "algae blooms".
Because the light is more
intense in the spring, summer and early fall and temperatures are more
amenable, most blooms occur at this time of year. Often a good supply
of nutrients for algae occurs during the spring and summer benthic
release periods. Although, blooms are not common in the winter, some
lagoons in Maine have been known to bloom profusely under the ice in
late winter and early spring. In the daytime, when algae is utilizing
light, it produces and releases oxygen. Dissolved oxygen in lagoons
can rise to very high levels during this period, often exceeding 10
mg/l or more. Because algae utilize dissolved C02 in photosynthesis
(C02 is a factor in the acid level in the water), the pH of the water
can reach high levels of 10 or more. At night, however, the process is
reversed. Then algae use oxygen during respiration and release C02
instead. This can deplete the supply of oxygen in the lagoon and may
lower the pH if the alkalinity is low. Because of these differences
between day and night, algae can produce dramatic diurnal effects on
the D.O. levels in lagoons. Also, the decay of dead algae within the
lagoon system uses up some measure of D.O. Overall though, algae are
thought to produce more oxygen in lagoons than they use.
There are many types of algae
and not all of them are green. Some are shade tolerant, some are
single celled and others form long filaments. Blue green algae can be
particularly noxious when it blooms and can form large slimy mats of
decaying algae after it dies. Despite the many differences in algae,
most of them contribute to the operation and the problems associated
with TSS in lagoons in much the same way.
5.2.4 Algae Problems
During the lagoon visits and surveys
made by the lagoon task force in preparation of this document,
operators reported the following problems associated with excess
algae:
1. TSS effluent violations
2. Depletion of oxygen levels at night.
3. The algae die and cause a BOD demand which can contribute to BOD
violations
4. Cause high pH problems and pH violations, destroy alkalinity
5. Contribute to odor problems during decay
Other less common problems reported were:
1. Certain types of algae clog effluent filters
2. A visual impact to the receiving water
5.2.5 Control of Algae
Unfortunately, there is a common
misconception among some operators that lagoons are mostly
uncontrollable treatment systems that do what they do. The results of
our survey revealed that some of our lagoons systems are not being
actively operated. On the other hand, there are also a significant
number of lagoons that are being actively managed in an attempt to
maximize treatment. The operators of these lagoons report that they do
have some control over their systems and have some success in
controlling the levels of algae. Although algae is a fundamental and
natural part of the proper operation of lagoons, in many systems it
does reach problem levels and can cause effluent violations. Before
any control action for algae is considered , its potential affect on
other parameters needs to be evaluated first. For example, reducing
detention time to prevent algae from developing to excessive levels in
the first place, may have a negative affect on BOD removal.
The following actions are
being used with varying degrees of success by operators in Maine to
avoid the TSS problems that are caused by algae:
1.
Controlling the loading rate
within the system to prevent excessive
algae growth or to control the type of algae that does grow. It was
reported at a few facilities during our survey that certain types of
algae prefer certain loading rates, hence the type and the amount
could be controlled by manipulating the loading. Although the
literature on lagoon operation should be checked for guidance on this
option, just what loading rate affects which algae is probably
somewhat facility specific and may have to be determined
experimentally on site. The loading can be increased or decreased to
specific cells. This control procedure was attempted at these
facilities through step feeding, bypassing certain cells or adjusting
individual cell levels.
2.
Controlling the detention time
within the system or within specific
units. This is related to the above action. Decreasing detention time
can prevent excess algae from developing in the first place while
increasing it can let it complete its life cycle and die away before
it adversely affects the discharge. This is usually accomplished by
controlling the level of lagoons, putting or taking cells off line,
and by discharging at varying rates to create or reduce detention
times. Some operators have been able to control algae by recycling
effluent with either designed recycle pumps or portable pumps.
3.
Hold and release.
Those lagoons which have adequate storage
capacity, can monitor the effluent quality and then hold wastewater as
necessary until the effluent TSS has improved. Other facilities can
create short periods of holding time by discharging at higher rates
previous to anticipated algae blooms, then holding until die off or
until Daphnia reduces the algae/TSS level. Creating holding times of
as little as seven days has been reported to be effective in algae/TSS
control. The TSS levels in the effluent or in the individual cells can
be monitored to determine hold or release times. Experience in
operation and close observation can allow operators to predict when
algae blooms usually occur so they can anticipate when such actions
may be necessary.
4. Utilize Daphnia to consume
excess algae.
Some operators maintain a culture of Daphnia and
add it at critical algae levels. It occurs naturally at sufficient
levels at some facilities. Some operators distribute this natural
Daphnia from one cell to another manually, by pumping or by recycling
effluent.
5. Selecting which cell
to discharge from. Often
one unit, even an upstream one, may have a better TSS level than the
final, traditional discharge point. If pumping to achieve this is not
part of the design, a portable pump can be used.
6. Varying the vertical
level of the discharge draw off to draw from the zone of best water.
This can be used to improve the discharge
directly or to contain algae within certain units.
7. Shade.
Although, there were no reports of success
in actively culturing duckweed for this purpose, duckweed cover was
reported to naturally shade out excessive algae at some facilities.
Although using artificial covers to create shade has been reported to
be of success in some other states, the only trial in Maine was
ineffective. There may be some potential in the use of shade to
control algae in Maine if an inexpensive and practical way can be
found to do it.
8. Observation and
records. Observing a
particular lagoon system over time and recording the dates and other
details regarding algae blooms and related phenomena may enable
operators to take measures to control algae levels and TSS before they
become a problem. For example, some operators have determined when
algae typically becomes a problem at their facility and release water
ahead of time to create holding or detention time in anticipation of
the event.
9. An effective process
control monitoring system can identify developing algae and TSS
problems before they occur.
Tracking TSS , algae, Daphnia, D.O., pH and other
trends in the discharge and within the system in graphic form can
alert operators ahead of time to developing problems. A n-microscope
examination should be used on a regular basis to identify the types
and amounts of algae.
10.
Odors caused by decaying
algae are best controlled by preventing excess
algae from growing in the first place. In some cases, increased mixing
and outboard motor boats have been used to break up floating algae
mats.
11. Dr. Michael Richard
believes that if C02 levels are controlled
through the consumption of alkalinity in nitrification without the
denitrification step to recover alkalinity then algae will not bloom.
In this case, the C02 available for algae growth is limited to that
which can be transferred from the air. However, this operational
scheme may cause a pH problem. This operational strategy was not
observed during our lagoon survey.
5.2.6 Daphnia
The only other reported significant cause of
TSS violations in lagoons in Maine were attributed to the discharge of
excessive levels of Daphnia. In most cases, however, Daphnia was
reported to reduce TSS by controlling algae. Daphnia populations
usually increase in response to the algae. Because algae is one of its
primary food sources, it usually increases in numbers after the algae
has already started to bloom. In some cases, the Daphnia increases
quickly enough to limit the amount of algae before it causes TSS
effluent violations. In others, it is credited with reducing the
magnitude of the TSS violations that do occur. In a few cases, the
Daphnia itself becomes so numerous in response to algae populations
that it becomes the major constituent of the TSS in the effluent.
These violations are caused by its discharge in living and dead forms.
Excess Daphnia in effluents and in the BOD test bottle can also
contribute to BOD demand by using oxygen through respiration or in
decomposition.
5.2.7 Use and Control of Daphnia
Usually, the level of
Daphnia is encouraged in lagoons rather than controlled. However, high
nitrite levels can work against promoting the growth of Daphnia
because it is toxic to them. Also, they may be prevalent in the spring
time, but become low in numbers by mid summer when high numbers are
expected. Many operators seed and promote it for algae control.
However, if the control of Daphnia levels does become necessary, it is
best done indirectly by controlling the amount of algae. Because an
excess of Daphnia is caused by an excess of algae, some of those
actions listed above for controlling algae will also be effective in
controlling Daphnia.
5.3 BOD
RELATED PROBLEMS
Introduction
High Strength Wastes
Partial Nitrification and Dentrification
Benthal Release of BOD
Recycling of BOD
5.3.1 Introduction
BOD violations have been
noted in operating facilities in all seasons and stem from a number of
causes. Some of these violations may not be real, stemming from
improper sample collection techniques or from improper testing
procedure, or other operational factors. A number of biochemical
processes are at work in lagoon systems that can increase the
likelihood of effluent violations. These can be influenced by; high
strength wastes, partial nitrification, benthal release of high BOD
materials and shifting or recycling BOD in the form of algae, daphnia,
duckweed or other organisms. Recognition of these factors with
monitoring and control (to the extent possible) can assist the
operator in managing their lagoon facility to limit adverse impacts of
these processes.
5.3.2 High Strength Wastes
The addition of septage
and trucked wastes to lagoon systems can exert a significant load on
the process. These wastes, by their nature, are extremely high in BOD
and TSS. The BOD load can cause localized depression of the dissolved
oxygen and the inability of the system to assimilate the load unless
significant aeration is available and a long detention time is
provided. The TSS load increases the rate of sludge accumulation and
leads to benthal BOD releases (discussed below) that can cause
significant operating problems. Lagoon systems should not accept this
waste without recognizing the possible impacts and developing the
monitoring program necessary to track these systems, implementing the
appropriate pretreatment program or addition system and without
initiating the appropriate action when critical levels are approached.
5.3.3 Partial Nitrification and Denitrification
Partial Nitrification
Nitrification is a
biological process involving a unique group of organisms that oxidize
ammonia to nitrite and then to nitrate, creating new generations of
organisms in the process. This occurrence is normally restricted
because the predominate organisms in treatment processes utilize
organic material as a food source and are effective competitors for
the oxygen necessary for assimilation of food and reproduction (this
competition restricts the growth potential of the nitrifying
organisms). But, once the majority of the organic material is
utilized, this competition is reduced and the nitrification process
can occur with less restrictions. So what's the problem, you might
ask? True, nitrification can be seen as an indication that the
assimilation of organic material has proceeded to the desired extent,
but the nitrification reaction uses oxygen and can inadvertently be
measured as BOD in the test procedure if nitrification takes place
during the incubation period (the wastewater added to the BOD bottle
contains nitrifying organisms and therefore a "seed"). In reality the
facilities that are exhibiting nitrification during their BOD tests
are treating the wastewater to a higher degree than facilities that
don't (unless, of course the facility completely nitrifies during the
course of treatment and no nitrogenous demand remains). The
nitrification process also consumes alkalinity and can upset the pH
balance within lagoons causing violations.
Denitrification
In the absence of
oxygen, facultative organisms can use the oxygen taken up during the
nitrification process (now in the nitrate form) for their own growth.
They release gaseous nitrogen, add alkalinity and produce new cells as
byproducts of this reaction. This process, known as denitrification,
occurs in an anoxic environment (low dissolved oxygen) and require a
source of carbon (organic material or BOD) to proceed. You can often
observe very small bubbles rising to the surface when denitrification
is taking place. It resembles mist or light rain on the surface of the
lagoon. If this reaction is occurring you know that nitrification is
occurring in your system and that, in some locations, conditions are
ideal for denitrification.
Control of these Processes
Both of these reactions are temperature
dependent, with increased activity at higher temperatures. Therefore,
lagoons can cycle in and out of nitrification and denitrification
seasonally. This can cause apparent violations of discharge parameters
and other operating problems. First, let's discuss nitrification. As
noted above, it is a two part process, with the first step converting
ammonia to nitrite and the second step converting nitrite to nitrate.
The importance of this is that nitrite can interfere with chlorine
based disinfection processes, causing ineffective disinfection at
normal doses. Operators should recognize that they may experience
seasonal nitrite increases that require an increased chlorine dose to
achieve an effective kill, and either monitor the nitrite level or the
effectiveness of their chlorination process as a control methodology.
The two step nitrification
process also uses a lot of oxygen and alkalinity. For each gram of
ammonia converted, 4.33 grams of oxygen are used and 7.14 grams of
alkalinity are consumed. This oxygen utilization increases electrical
costs and the alkalinity consumption can lead to effluent pH
violations in wastewaters with low alkalinity. Operators have tried to
increase the organic load at their facilities to limit the ability of
the nitrification reaction to occur with mixed success. Others have
increased the detention time and the aeration rate during the warmer
months to attempt complete nitrification. If the flexibility is
available both techniques can reduce the operational problems
associated with these processes. Increasing the organic load by
reducing the detention time will reduce the system operating cost and
improve control, but if the flexibility is not available and the
monitoring is not in place to track the system performance, effluent
violations can result. The second control philosophy can be an energy
intensive process because, as you increase the detention time and
increase the aeration rate to complete the nitrification reaction, you
may increase your energy costs significantly.
5.3.4 Benthal Release of BOD
Benthal Release of High BOD
materials
As suspended solids settle and
dead microorganisms accumulate, a sludge layer builds up on the bottom
of the lagoons. This layer is decomposed by anaerobic and facultative
organisms over time. This process releases organic acids that are very
high in BOD. Operating experience has shown that this release is often
highest in the early spring after ice out when the anaerobic bacteria
become active. This release can be a significant load on the treatment
system at a time when biological activity is low and other factors are
causing stress on the system (e.g., inflow, infiltration, slowly
increasing temperature, etc.)
Control Options Available
A number of techniques have been
used by operators to minimize the impact of this load and are
described in the following paragraphs.
Control Depth of Bottom
Layer.
The State of Vermont has evaluated the impacts of
sludge layers and recommend that operators develop a monitoring
program to track the build up of this layer. They recommend that this
program provide complete coverage of the lagoon bottom, recognize that
blanket depth may vary with time of year (therefore be consistent in
the program and compare readings at similar times of year to gauge
growth of the blanket), and they caution that a compacted layer may be
difficult to measure accurately. Their experience shows that some
sludge layers will plug a sludge judge and that to get an accurate
measurement you must include the difference between the water level in
the sludge judge and the lagoon surface (in penetrating this solid
layer you can plug the judge and push the underlying material out of
the way and this depth is represented by the water surface
differential). When the sludge depth reaches 10 inches they recommend
removal of the material to limit adverse impacts to the system's
operation. A yearly budget allocation is recommended to build a
reserve account for this activity, as it can be very expensive.
Limit the Solids Load
on the System.
Another technique is to limit the TSS load to the
facility by eliminating trucked waste and septage additions to your
system and by requiring pretreatment of wastes from users with high
BOD or TSS loadings.
Increase Detention Time in
the Spring.
Some operators manage the release from their
systems so that the storage potential is maximized at the time of
spring flow. This is often done to capture the high spring flows
caused by I/I but, also creates the opportunity to store and treat
this higher strength waste for a longer period.
Increase Aeration Rate in the
Spring.
Some operators turn on additional aerators or blowers in the spring of
the year to provide additional dissolved oxygen to increase the
biological activity during high load period.
5.3.5 Recycling BOD
Algae, Daphnia and duckweed growth in lagoon
systems can cause operating problems, and in some cases, can offer
operational advantages. These are discussed in more detail in other
sections of this manual. This segment will discuss the operational
impacts of the death and recycling of these organisms. When adverse
conditions are present in a system, these organisms will die and the
remaining material may fracture or lyse, releasing the cell contents
to the wastestrearn as BOD. The heavy material will settle to the
bottom. Often, these cells do not lyse and simply settle and
accumulate on the bottom. In this way they become a sludge deposit
that undergoes decomposition and causes the concerns outlined in the
previous paragraphs. A few aspects of this process are worthy of note.
First, these organisms are predominantly in the second, third or
subsequent lagoons (because the are able to develop only after the
competing microorganisms have reduced the BOD available and died off),
while TSS removal occurs largely in the first lagoon. The importance
of this is the understanding that there are mechanisms at work that
develop solids layers in subsequent lagoons, causing the need to
measure and track the development of this layer. Second, the final
lagoons in a system often have less installed aeration potential.
Therefore, if a significant benthal load is released in these lagoons,
they are not as able to manage that impact without a violation.
Finally, algae obtain the carbon necessary for growth from the
atmosphere through a fixation process. In this fashion they are adding
BOD to the treatment system. However, they also produce oxygen to
satisfy some of their demand, so we need to recognize that facilities
that exhibit algal growth may be achieving excellent BOD removal and
treatment of the wastewaters.
5.4 SEASONAL
Introduction
Reduced Treatment (Cold) Aerator Maintenance (winter) Algae, Daphnia
Nitrification
Rising Sludge
Benthal Release
Dissolved Oxygen.
Odors
5.4.1 Introduction
Operators that live and work
in Maine have to contend with and prepare for the different seasons.
Operators of lagoon systems must change the operation of the system
along with the changing seasons. Lagoon systems perform differently
during summer months than winter months, plus, changes take place
during the spring and fall. From conversations with operators during
the site visits, the Lagoon Task Force found that the difference from
one season to another is part of the challenge for lagoon operators.
5.4.2 Reduced Treatment (Cold)
The rate of biological
metabolism is influenced by a number of factors and one that causes a
significant impact is temperature. During the colder months there will
be less biological activity and so treatment of the wastewater will be
reduced. One technique to minimize the impact of this phenomenon is to
fill the ponds to maximum depth to take full advantage of available
space and maximize detention time. Because colder water dissolves more
oxygen and biological activity is reduced, less aeration is needed at
colder temperatures.
5.4.3 Aerator Maintenance (Winter)
Since less aeration is
required during colder months than warmer months, operators with
aspirating aerators should remove aerators that will not be needed
during winter months and place them in a storage building. Winter
months are a good time to inspect aerators and do any needed
maintenance. It is not a good idea to leave non-operating aerators out
in the harsh winter weather. Using more aerators than needed will
waste power (money), can cause excess foaming and unnecessary wear of
equipment. Some operators leave all aerators operating in the event
that if some aerators freeze and kick out, they will still have some
aeration at the end of the winter season. Some operators take unneeded
aerators out for maintenance. If aerators freeze and kick out, or
additional aeration is needed, the operator can cut the ice with an
ice chisel, or chainsaw to remove the aerator and replace it. Many
times, anti-freeze poured down the draft tube will thaw the ice in the
draft tube allowing the aerator to be started. A flat bottom boat can
be used and will easily slide across. the ice to get to the aerator
needing attention. (This should never be done alone nor without proper
safety equipment.)
5.4.4 Algae, Daphnia
Algae and daphnia (a very
small crustacean, also known as a water flea) are a common cause for
TSS violations at a lagoon system and they both occur during warm
weather. When the water warms up, the algae start growing. Usually
after there is an algae bloom, the daphnia will start to show.
Sometimes there will be so many daphnia, the water or side of the
lagoon will turn a reddish color. The daphnia will consume the algae
and once the algae is gone most of the daphnia will die off. In early
spring, some operators will scrape the sides of the liner, or pick
some rocks from the side of the lagoon. They will then bring this to
the building and place it in a bucket, or aquarium with an air pump to
start daphnia growing before the algae bloom starts. Then when the
water warms up and the algae starts to grow, the operator will seed
the pond with the daphnia to eat the algae before the algae becomes a
problem. Some operators have had some success with the use of daphnia,
others have not. There are many things an operator can try to produce
a good effluent, usually the operator will need to do several things
at a time to produce a good effluent. See the section on TSS and BOD
for more information.
5.4.5 Nitrification
Nitrification occurs during the summer season
and into early fall. Nitrification starts when the water temperature
in the ponds reaches 12 to 15'C. It usually starts in the first pond
and can be tracked to the other ponds. Nitrification happens when
ammonia nitrogen is convened to nitrite by Nitrosomonas bacteria and
nitrite is convened to nitrate by Nitrobacter bacteria. An operator
can track the nitrification process by doing the BOD5 and CBOD5 tests,
ammonia, nitrite, nitrate and alkalinity on each pond effluent. If
nitrification is occurring, the D.O. and pH levels drop, BOD5 test
results may be elevated and if nitrification is not completed, a
considerable increase in chlorine demand will occur. The operators
should check the effluent nitrite levels if the chlorine demand keeps
increasing. Partial nitrification and high nitrite will increase the
demand. The operator should also test alkalinity, ammonia nitrogen,
nitrite and nitrate on each pond effluent to see how they change and
how nitrification moves through your system. As nitrification takes
place, alkalinity is used and the pH will drop. See the section on BOD
for more information on nitrification.
5.4.6 Rising Sludge
Rising sludge usually happens during spring
turnover when the water temperature warms up, clumps of sludge will
rise to the surface. Rising sludge usually happens in the first pond,
as this is where most of the sludge is typically concentrated. Add
aeration if possible for mixing and for extra D.O..
5.4.7 Benthal Release
Benthal release occurs during
the spring, as the water temperature warms up. During the winter
months when the temperatures are low, there is little biological
activity taking place in the lagoon, including the sludge layer. When
the water temperature warms up in the spring, biological activity
increases in both the water column and in the sludge layer. This
increase in activity creates a high oxygen demand. At this time you
want to keep a close eye on D.O.'s and have available aeration in
place so as to maintain a D.O. of around 2.0 mg/L in the early
morning.
5.4.8 Dissolved Oxygen
A D. 0. monitoring
program is critical to understanding the seasonal shifts occurring in
a lagoon system. D.O. in lagoon systems is impacted by 1) benthal
release, 2) spring turnover, 3) organically overloaded pond, 4)
midnight dumping, 5) algal respiration, and 6) nitrification. From
spring to early fall the D.O. should be checked with a field probe
twice a day at the same place and depth, early morning and again in
the afternoon. If there is algae in the lagoons, the D.O. can be
around 1.0 mg/L in the morning and greater than 10.0 mg/L in the
afternoon. During the colder months less aeration is needed, but D.O.
readings should be checked twice per week
.
5.4.9 Odors
With a well designed, well
operated system, odors should not be a problem. However, some odors
may occur during the spring, when temperatures start warming up and
biological activity increases. If odors become a problem in the
spring, check D.O.s and add aeration and mixing if possible. Duckweed
can also cause odors, but normally they are not strong enough to cause
a problem. Other causes for odors can also occur if your influent is
pumped to the plant and the influent sits in a wet well, or force main
for long periods between pumping. To correct an odor problem you first
need to identify the source.
5.5 MONITORING
Introduction
Monitoring Plan
Other
5.5.1 Introduction
It is very important that
any treatment system, set up and maintain a monitoring program. Over
time, as the operator becomes familiar with the system, he or she
will be able to use the program to anticipate changes in the system
and take timely action to minimize their impact. The following is a
suggested monitoring plan. It includes both permit compliance
monitoring and operational monitoring.
5.5.2 Monitoring Plan
The following table lists
recommended monitoring considerations to monitor and evaluate lagoon
performance. These recommendations should be used in conjunction
with normal operating schedules and licensing requirements for
effluent monitoring.
Table I
|
Parameter
|
Location
|
|
|
|
|
pH
|
Influent /
Effluent |
1/day
|
1/day
|
grab
|
|
temperature
|
Influent /
Effluent
|
1/day
|
1/day
|
grab
|
|
settleable solids
|
Influent /
Effluent
|
1/day
|
1/day
|
grab
|
|
filtered BOD
|
Influent /
Effluent
|
2/week
|
2/week
|
composite |
|
BOD
|
Influent /
Effluent
|
2/week
|
2/week
|
composite |
|
CBOD
|
Influent /
Effluent
|
2/week
|
2/week
|
composite |
|
alkalinity
|
Influent /
Effluent
|
1/week
|
1/month |
grab
|
|
ammonia
|
Influent /
Effluent
|
1/week
|
1/month |
grab
|
|
nitrite/nitrate
|
Influent /
Effluent
|
1/week
|
1/month |
grab
|
|
Dissolved Oxygen
|
Individual Cells |
2/day
|
2/week |
meter |
|
pH
|
Individual Cells
|
1/day
|
2/week |
grab
|
|
temperature
|
Individual Cells
|
1/day
|
2/week |
grab
|
|
BOD / Filtered BOD
|
Individual Cells
|
1/week
|
1/month
|
grab
|
|
CBOD
|
Individual Cells
|
1/week
|
1/month
|
grab
|
|
TSS
|
Individual Cells
|
1/week
|
1/month
|
grab
|
|
alkalinity
|
Individual Cells
|
1/week
|
1/month
|
grab
|
|
nitrite
|
Individual Cells
|
1/week
|
1/month
|
grab
|
|
nitrate
|
Individual Cells
|
1/week
|
1/month
|
grab
|
|
microscope
|
Individual Cells
|
1/week
|
1/month
|
grab
|
|
D.O. Profile(1 ft. int)
|
Individual Cells
|
1/month
|
------------
|
grab
|
5.5.3 Other
In addition to the routine monitoring
suggested above, the operator should measure the sludge depth in
each lagoon, percent solids and percent volatile solids of the
sludge in early spring and fall. Air patterns should be observed
daily. The pressure gauges on the air blowers should be read and
recorded daily.
Data from individual tests can be graphically displayed
on trend charts so that the process status can be seen at a glance.
6.0
REGULATORY CONSIDERATIONS
6.1 Regulatory Provisions
Authority for the Secondary
Treatment Information regulation is based on sections 301 and 304 of
the Federal Water Pollution Control Act, commonly known as the Clean
Water Act (the Act), as amended. Limits for POTWs are based on two
major considerations:
1.
Water quality standards.
Permit limits based on water quality
standards are evaluated on a case-by-case basis to assure that a
discharge does not cause or contribute to water quality standard
violations. Where water quality concerns are present, limits must be
set to protect all uses and criteria of the receiving water.
2.
Technology based limits.
These apply to all facilities and
establish the minimum standards. For POTWs they are set forth in 40
CFR Part 133. The 1987 amendments to the CWA allow alternate limits
for treatment for waste stabilization ponds, trickling filters, and
others referred to as "equivalent to secondary treatment". Those
limits are also described in 40 CFR Part 133. The permit writer is
given some latitude to apply these alternate limits on a case-by-case
or alternative State requirements that conform to the BOD5 and TSS
consistently achievable through proper operation and maintenance by
the median (50th percentile) facility in a representative sample.
The legislative history for
secondary treatment recognizes that certain biological treatment
processes such as trickling filters and oxidation ponds, lagoons and
ditches are effective in achieving significant reductions in BOD and
TSS, when properly designed. For the most part, these treatment
methods, are easier to operate, and are particularly useful in smaller
communities. Trickling filters and waste stabilization ponds have long
been regarded as appropriate secondary processes for municipal
wastewater. Nevertheless, POTWs that use these treatment processes may
not consistently meet the current requirements for secondary
treatment, due largely to varying geographical/climatic and seasonal
conditions.
Thus, the language of the Act and the legislative
history explicitly allow the use of certain biological treatment
facilities to meet secondary treatment requirements, regardless of
their capability to consistently provide for 85 percent removal or 30
mg[L of BOD5 and TSS on a 30- day average.
The current federal regulation
describes the minimum level of effluent quality attainable by
facilities eligible for treatment equivalent to secondary treatment in
terms of the parameters - BOD, TSS and pH. The 30-day average BOD5 and
TSS shall not exceed 45 mg/L. The 7-day average BOD5 and TSS shall not
exceed 65 mg/L. The 30-day average percent removal shall not be less
than 65 percent. The effluent values for pH shall be maintained within
the limits of 6.0 to 9.0. Where data are available to establish CBOD
limitations for a treatment works, the permitting authority may
substitute the parameter CBOD5 for the BOD5, on a case-by-case basis
provided that the levels of CBOD5 are not less than the following: i)
The 30-day average shall not exceed 40 mg/L, ii) The 7-day average
shall not exceed 60 mg/L, iii) The 30-day average percent removal
shall not be less than 65 percent. Alternative state requirements may
be authorized after notice and opportunity for public comment and
subject to EPA approval. Alternative requirements shall conform to the
BOD5 and TSS effluent concentration consistently achievable through
proper operation and maintenance by the median (50th percentile)
facility in a representative sample of facilities within a State or
contiguous geographical area that meet the definition of facilities
eligible for treatment equivalent to secondary treatment. Where data
are available, the parameter CBOD5 may be used for effluent quality
limitations. Where concurrent BOD effluent data are available, they
must be submitted with the CBOD data as part of the approval process.
Permit adjustments shall require, more stringent limitations when
adjusting permits if. 1) For existing facilities the permitting
authority determines that the 30-day average and 7-day average BOD5
and TSS effluent values that could be achievable through proper
operation and maintenance of the treatment works, based on an analysis
of the past performance of the treatment works, would enable the
treatment works to achieve more stringent limitations, or 2) For new
facilities, the permitting authority determines that the 30-day
average and 7-day average BOD5 and TSS effluent values that could be
achievable through proper operation and maintenance of the treatment
works, considering the design capability of the treatment process and
geographical and climatic conditions, would enable the treatment works
to achieve more stringent limitations.
6.2 Analysis of Lagoon and Pond Capabilities
Consistent with the Federal
program, the Lagoon Task Force carried out an analysis of treatment
process capabilities and plant performance for lagoons and ponds that
are described below. Lagoons and ponds are considered to be basins
within which natural stabilization processes occur with the necessary
oxygen coming from atmospheric diffusion, photosynthetic and/or
mechanical sources.
An empirical approach using data from
existing facilities was used to assess the effects of climatic and
seasonal variation on process capabilities for lagoons and ponds in
Maine.
In selecting the sample of facilities for the plant
performance analyses, consideration was given to assure that the
treatment capabilities of the selected POTWs were representative of
the true treatment capabilities of lagoons and ponds in Maine.
Facilities were included in the sample if it was determined that the
facility design, operation and maintenance conformed to generally
accepted principles of engineering and standard practice.
Additionally, facilities were excluded where exceptional performance
resulted from augmentation of the basic unit process by "add-on"
processes which go beyond secondary treatment. The data for each POTW
in the sample include monthly average values for effluent quality.
This approach is consistent with the Federal regulatory requirements.
In order to determine treatment capabilities of lagoons and ponds, the
task force assumed that the value should reflect an effluent quality
that is attainable by median of POTWs using that process.
The following plant performance data from the
sample of well-designed, operated, and maintained lagoons and ponds
represent interpolated values for BOD5 and TSS effluent quality based
on monthly averages that were reliably, i.e., 95 percent of time,
achieved by a given percentage of POTWs in the sample.
Table 2.
Sample Size (N) = 19
|
Percentage of
POTWs
|
BOD5(mg/l)
|
TSS (mg/l)
|
|
First Quartile
(25%)
|
20
|
20
|
|
Second Quartile
(50%)
|
25
|
22
|
|
67th Percentile
(67%)
|
35
|
27
|
|
Third Quartile
(75%)
|
38
|
37
|
|
Ninth Decile (90%)
|
70
|
42
|
The data from the plant
performance analyses indicate that half of the POTWs in the sample
using lagoons and ponds processes achieved a BOD5 effluent quality of
a least 25 mg/L and a TSS of at least 22 mg/L.
6.3 Recommended Regulatory Changes for BOD5 and
TSS
The analysis does not support
adjusting BOD5 and TSS effluent limitations across the board for
lagoons and ponds in Maine. The analysis does support adjusting BOD5
and TSS effluent limitations on a case-by-case basis. No adjustments
would be allowed where the adjusted effluent concentration would have
an adverse effect on water quality, public health, or designated uses
of receiving waters. The test for determining adverse effects on
receiving waters must involve adequate modeling analyses. Effluent
BOD5 and TSS concentrations for eligible facilities could range up to
a maximum allowable value of 45 mg/L in a period of 30-day average.
To account for variations in
lagoon and pond performance within the range e.g., 30 to 45 mg/L,
which may occur due to differences in design, wastewater
characteristics, climate, seasonal and unique local factors, the task
force proposes that the adjusted permit limitations for lagoons and
ponds be set based on an individual facility's performance capability.
The task force is recommending that a facility not be allowed to
obtain effluent limitations that are any less stringent than the level
of effluent quality that a facility is capable of achieving. But not
withstanding water quality considerations, no facility would receive
30-day average limits of less than 30 mg/L. This will help to minimize
additional pollutant loadings and help ensure that facilities continue
to operate in accordance with their design capabilities. The facility
must have been designed and operated properly to obtain adjusted
effluent limitations.
For facilities designed after 1980, the design
should be based on accepted design standards such as TR-16 "Guides for
the Design of Wastewater Treatment Works", 1980 Edition. In general
for facultative stabilization ponds, 1) the organic loading of BOD5
may vary from 15 to 35 lbs. per acre per day, and 2) the pond should
be designed to normally operate within overall depths of 3 feet
minimum to 5 feet maximum. For partial mix aerated facultative ponds,
1) the detention time should be based on many variables such as waste
strength, volume, temperature and nutrient balance and intended
removal efficiencies. With normal biological reaction rates and
removal requirements, the hydraulic detention time generally should be
at least 20 to 30 days. An additional volume for sludge storage of
approximately 10% should be provided and the volume occupied by ice
should also be taken into account. The water depth should be 10 to 20
feet. The system should be capable of providing for normal oxygen
requirements of 2 lbs 02 per lb of BOD5 applied with the capability of
transferring 3 lbs 02 per lb of BOD5 for periodic high oxygen demand.
The aeration and mixing system should be capable of maintaining a 2
mg/L dissolved oxygen level at any point in the basin.
Proper operation means that the facility was
operated as designed and described in its approved operation and
maintenance (O&M) manual. In general, stabilization ponds should be
operated at a minimum operating depth of 3 feet and a maximum of 5
feet and the organic loading should not exceed 35 lbs BOD5 per acre. A
detention time of 90 to 120 days should be provided. For partial mix
aerated ponds, the hydraulic detention time should be at least 20 days
and the mechanical aeration equipment should provide 2 lbs 02 per lb
of BOD5 applied. In addition, the number of cells on-line should be
operated as provided by the design and described in the O&M manual.
The task force recommends that
effluent BOD5 and TSS concentrations could range up to a maximum of 45
mg/L as a 30-day average when:
a) the facility cannot consistently achieve secondary treatment
defined as a 30-day average of 30 mg/L 95 percent of the time based on
at least three years of monthly average data,
b) the facility provided information and data to demonstrate that the
problem is uncontrollable while using a properly designed and operated
lagoon or pond as the principal biological treatment process, and
c) there are no extenuating circumstances such as overloading or
industrial wastes.
The task force recognizes that
the performance of "equivalent treatment processes" may be affected by
differences in temperature, and that such facilities may exhibit
variation in performance depending on geographical, climatic or
seasonal factors. For a given facility, there may be significant
differences in performance from one period of the year to another. The
task force suggests that DEP permit writers consider the development
of seasonal permits that would reflect such differences in performance
where the differences are significant. If a seasonal permit is
developed, a specific time period, during which the different effluent
limitations would apply, should be established during the permit
revision process based on historical records for either mean monthly
ambient air temperature or effluent wastewater temperature.
6.4 BOD5 test versus CBOD5
The task force examined the
appropriateness of the current BOD5 test for analyzing the effluent
quality of lagoons and ponds. Where a treatment process provides full
or partial oxidation of ammonia (nitrification), the BOD5 test will
measure a combined effect of two types of BOD: carbonaceous
biochemical oxygen demand (CBOD) and nitrogenous oxygen demand (NOD).
An analysis of the lagoons and ponds in Maine showed that some systems
provide full or partial nitrification, especially during warm weather
months, while others do not. The data show that warm weather effluent
CBOD5 concentrations typically range from 10 to more than 90 percent
less than the measured BOD values.
The effect of nitrifying
bacteria exerting NOD in a test of an effluent sample will not
necessarily bear any relationship to in-stream NOD effects; those
effects will be governed by the presence or absence of nitrifying
bacteria in the stream itself as well as stream conditions, such as
depth, surface area for attachment, etc. Where in-stream nitrification
is significant, water quality analyses should account for the effects
of CBOD and NOD separately. For water quality limited segments and
water quality based permits, it is appropriate that the effluent
limitations provide for separate CBOD and NOD controls; in such
cases., the use of a BOD5 test may be inappropriate.
Where in-stream nitrification is
not occurring and there are no ammonia toxicity impacts, a separate
NOD control is not necessary as long as existing ammonia discharge
levels are maintained. The task force supports the concept of using
the CBOD5 test in place of the standard BOD5 test seasonally on a
case-by-case basis. The task force has not proposed an across-the-
board substitution because it believes that problems arising from the
use of the BOD5 parameter may not be experienced in all cases. The
task force recommends that a technology-based 30-day average CBOD5
limit should be 25 mg/L or may be increased on a case-by-case basis up
to 40 mg/L based on historical performance (water quality may take
precedence and require addition tests). CBOD substitution will be
allowed when:
a) parallel CBOD5 and BOD5 data (at the permit
frequency for a time period of April through November) have been
provided and show a problem with BOD5 compliance due to nitrification
in the BOD5 test results and that the CBOD5 is not directly correlated
with the BOD5 test results, and
b) baseline influent and effluent ammonia, nitrite and nitrate data
(same frequency and duration as the parallel CBOD5 and BOD5 data) have
been provided.
Prior to relicensing, the licensee
and DEP should develop a procedure to determine whether nitrification
is still occurring.
The task force recognizes that nitrification is affected
by differences in temperature, and that lagoons and ponds may exhibit
variation in performance depending on seasonal factors. For a given
facility, there may be significant differences in nitrification from
one period of the year to another. The task force suggests that DEP
permit writers develop seasonal CBOD permits for a specific time
period, during which the CBOD effluent limitations would apply. The
time period should be established during the permit revision process
based on historical records or a default time period of April through
November may be assigned.
|
Parameter
|
Location
|
|
|
|
|
pH
|
Influent /
Effluent |
1/day
|
1/day
|
grab
|
|
temperature
|
Influent /
Effluent
|
1/day
|
1/day
|
grab
|
|
settleable solids
|
Influent /
Effluent
|
1/day
|
1/day
|
grab
|
|
filtered BOD
|
Influent /
Effluent
|
2/week
|
2/week
|
composite |
|
BOD
|
Influent /
Effluent
|
2/week
|
2/week
|
composite |
|
CBOD
|
Influent /
Effluent
|
2/week
|
2/week
|
composite |
|
alkalinity
|
Influent /
Effluent
|
1/week
|
1/month |
grab
|
|
ammonia
|
Influent /
Effluent
|
1/week
|
1/month |
grab
|
|
nitrite/nitrate
|
Influent /
Effluent
|
1/week
|
1/month |
grab
|
|
Dissolved Oxygen
|
Individual Cells |
2/day
|
2/week |
meter |
|
pH
|
Individual Cells
|
1/day
|
2/week |
grab
|
|
temperature
|
Individual Cells
|
1/day
|
2/week |
grab
|
|
BOD / Filtered BOD
|
Individual Cells
|
1/week
|
1/month
|
grab
|
|
CBOD
|
Individual Cells
|
1/week
|
1/month
|
grab
|
|
TSS
|
Individual Cells
|
1/week
|
1/month
|
grab
|
|
alkalinity
|
Individual Cells
|
1/week
|
1/month
|
grab
|
|
nitrite
|
Individual Cells
|
1/week
|
1/month
|
grab
|
|
nitrate
|
Individual Cells
|
1/week
|
1/month
|
grab
|
|
microscope
|
Individual Cells
|
1/week
|
1/month
|
grab
|
|
D.O. Profile(1 ft. int)
|
Individual Cells
|
1/month
|
------------
|
grab
|
|
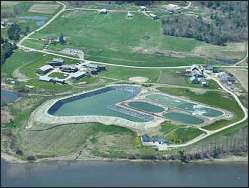
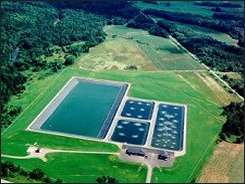


